In the complex world of trading, Contract for Difference (CFD) presents a unique proposition for traders looking to leverage market movements without owning the underlying asset. However, success in CFD trading requires more than just intuition or luck. It demands a solid understanding of technical analysis—a technique that can empower traders to make informed decisions. In this article, we’ll explore the tools and techniques essential for mastering technical analysis in CFD trading, ensuring you have a roadmap to trading success.
Understanding the Basics of CFD Trading
Before we dig into the nitty-gritty of technical analysis, it’s crucial to grasp what CFD trading entails. A CFD is a financial derivative allowing traders to speculate on price movements of various assets like stocks, commodities, or currencies without owning them. The key advantage here is the ability to trade on margin, offering the potential for significant returns with a smaller initial investment. However, this also means higher risk.
Why Technical Analysis Matters
Technical analysis focuses on studying historical price movements and trading volumes using charts and other tools. Unlike fundamental analysis, which looks at the intrinsic value of an asset, technical analysis is rooted in the belief that prices move in trends and that history tends to repeat itself. For CFD traders, this means that understanding these patterns can help predict future price movements, providing a competitive edge.
Essential Tools for Technical Analysis
Charts Galore
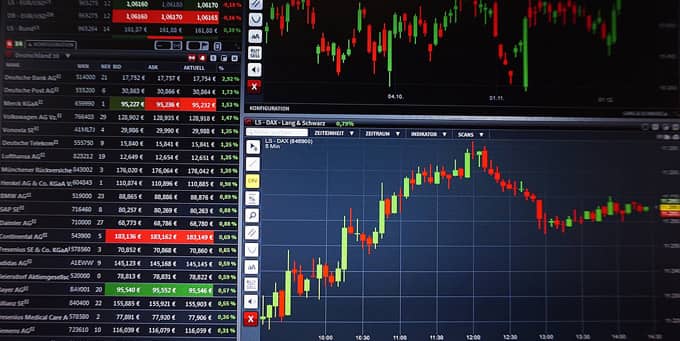
The backbone of technical analysis is charting. There are several types of charts—line charts, bar charts, and candlestick charts, each offering a different perspective on price movements. Candlestick charts are particularly popular among CFD traders due to their detailed representation of price action, showing the opening, closing, high, and low prices within a specified period.
Moving Averages
Moving averages are vital tools that help smooth out price data to identify trends over specific periods. There are different types of moving averages, including Simple Moving Averages (SMA) and Exponential Moving Averages (EMA). SMAs give equal weight to all data points, while EMAs give more weight to recent data, making them more responsive to recent price changes.
Relative Strength Index (RSI)
The RSI is a momentum oscillator that measures the speed and change of price movements. It oscillates between zero and 100, typically using a 14-day timeframe. An RSI above 70 usually indicates that an asset is overbought, while an RSI below 30 suggests it might be oversold. This tool can be invaluable for identifying potential reversal points in CFD trading.
Techniques for Effective Technical Analysis
Identifying Trends
Trend identification is critical in technical analysis. Trends can be upward (bullish), downward (bearish), or sideways (neutral). Tools like trendlines, Moving Average Convergence Divergence (MACD), and moving averages help traders identify these trends and make informed trading decisions.
Support and Resistance Levels
Support and resistance levels are price points where an asset tends to stop and reverse. These levels are significant because they indicate the psychological barrier of traders. When the price approaches these levels, traders can expect increased buying or selling activity. Recognizing these levels can help CFD traders set entry and exit points, maximizing profit potential.
Using Technical Indicators
In addition to RSI and moving averages, several other technical indicators can aid in analysis. Bollinger Bands, Stochastic Oscillators, and the MACD are among the most popular. Bollinger Bands, for instance, consist of a middle band (an SMA) and two outer bands. These bands widen and narrow based on volatility, helping traders identify overbought and oversold conditions.
Practical Tips for Implementing Technical Analysis
Backtesting Strategies
One of the best ways to gauge the effectiveness of a trading strategy is through backtesting. By applying your technical analysis techniques to historical data, you can see how well your strategy would have performed in the past. This can provide valuable insights and build confidence before executing real trades.
Keeping a Trading Journal
Documenting your trades and the reasoning behind them is a practice that can yield significant benefits. By keeping a trading journal, you can analyze what works and what doesn’t, helping refine your strategies over time. This reflection can be instrumental in becoming a more disciplined and successful CFD trader.
Continuous Learning
The financial markets are dynamic, and so is the field of technical analysis. Continuous learning and staying updated with the latest tools, techniques, and market trends are crucial. Engaging with trading communities, attending webinars, and reading up-to-date trading literature can keep you ahead of the curve.
Conclusion
Technical analysis is an indispensable tool in CFD trading, providing insights into market trends and helping traders make informed decisions. By mastering the various tools and techniques discussed—charts, moving averages, RSI, and more—you can enhance your trading strategies and increase your chances of success. Remember to backtest your strategies, maintain a trading journal, and commit to continuous learning. These practices will not only sharpen your skills but also pave the way for a successful trading career. Ready to elevate your CFD trading game? Start incorporating these technical analysis techniques today and watch your trading acumen grow.